

Guest post by A.J. Marian Walhout, PhD.
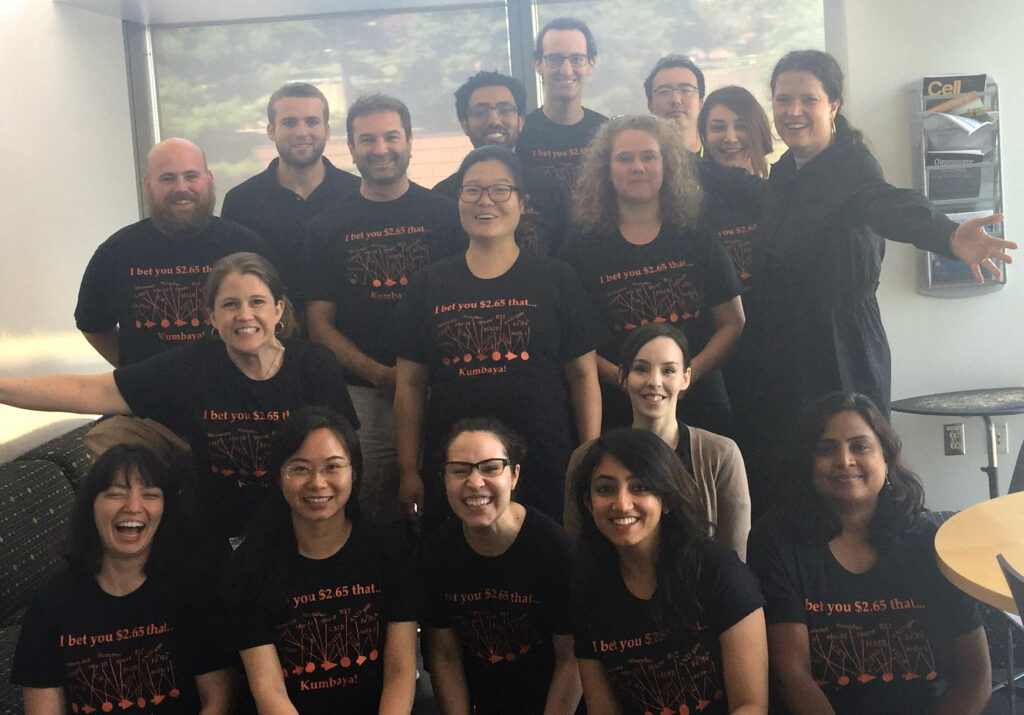
Massachusetts, March 2020: The early days of the COVID-19 pandemic that would profoundly affect us all. Labs shut down abruptly, assay trials were disrupted, some experiments in progress were thrown out. Now what? With pipettes unused on the bench and the foreseeable future unclear, how long would this take? A week or two? Oh, how naïve we were. Many labs pivoted to do research on the new virus, leading to many papers, demonstrating that publishing doesn’t have to take months. But I digress… When the lockdown started, I immediately thought my lab could use this time to work on a project that I always wanted to start but never seemed to have the time for. I discussed this project with the lab via the relatively new Zoom platform we are all so familiar with now. (Anybody know how they outcompeted Skype?)
In my lab in the Program in Systems Biology at the University of Massachusetts Medical School, we study how metabolism affects gene expression and vice versa. We do this at a network level using the nematode Caenorhabditis elegans as a model system. Over the years, we and others had made great strides in gaining insights into transcriptional networks. More recently, we had reconstructed a genome-scale metabolic network model, which we can integrate with gene expression data to understand how the two biological processes affect each other.
However, in many studies, we found that relatively straightforward online visualizations of C. elegans metabolic pathways were lacking, and we were drawing pathways by hand on scraps of paper or on white boards to help us understand our results and to derive novel hypotheses. Popular (and excellent) tools such as KEGG provide visualizations, but we found these “pan-organism” maps to be often incomplete and cumbersome to navigate due to gaps in the pathway, missing genes, or genes assigned to incorrect pathways. My dream was to have a map for metabolism similar to traffic maps on mobile devices where one could “travel” from one metabolite to another via different routes and be able to zoom in and out to see which enzymes and transporters are involved in which reactions. This is, of course, very hard to do. So, at the start of the lockdown/work-from-home phase of the pandemic, we embarked on a group project to draw maps for individual C. elegans metabolic pathways using a standardized format and make these available on our WormFlux website . We first agreed on where a pathway starts and ends, which is not a trivial task because pathways all connect into the larger metabolic network. We settled on a total of 62 pathways and assigned each pathway to a duo or trio of lab members, making sure they would work with different colleagues on different pathways via video conferences. This approach ensured that lab members talked to each other, worked together, and communicated with the larger group, which helped to keep a sense of purpose and morale during this very strange time.
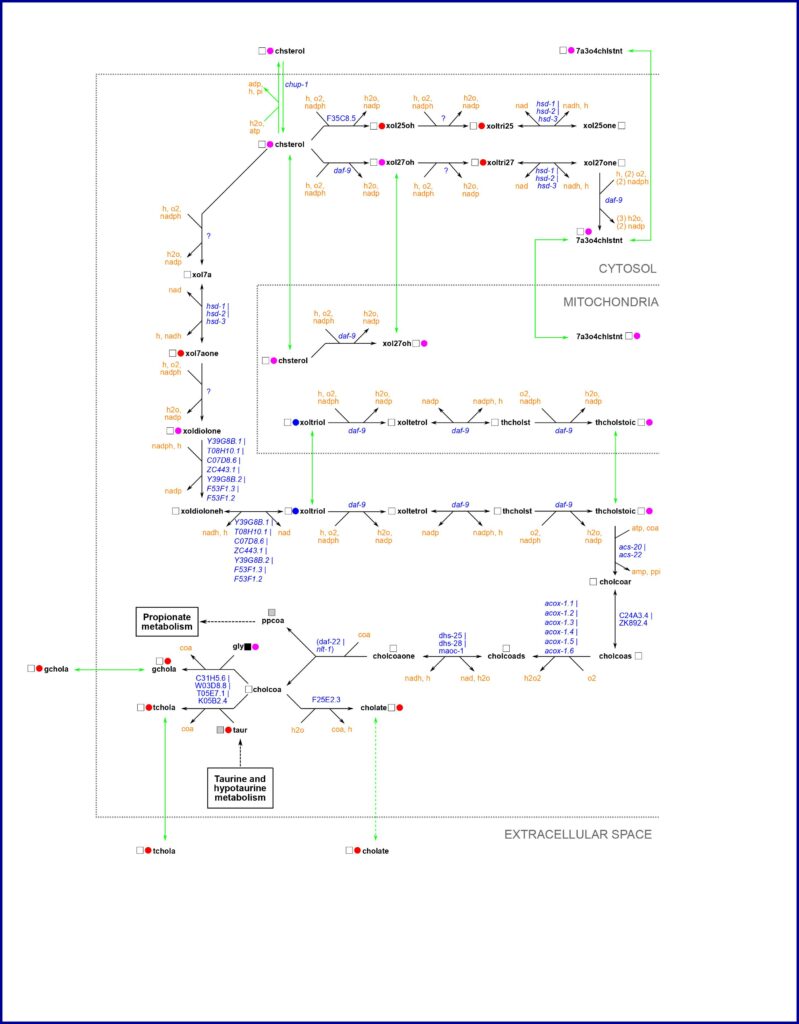
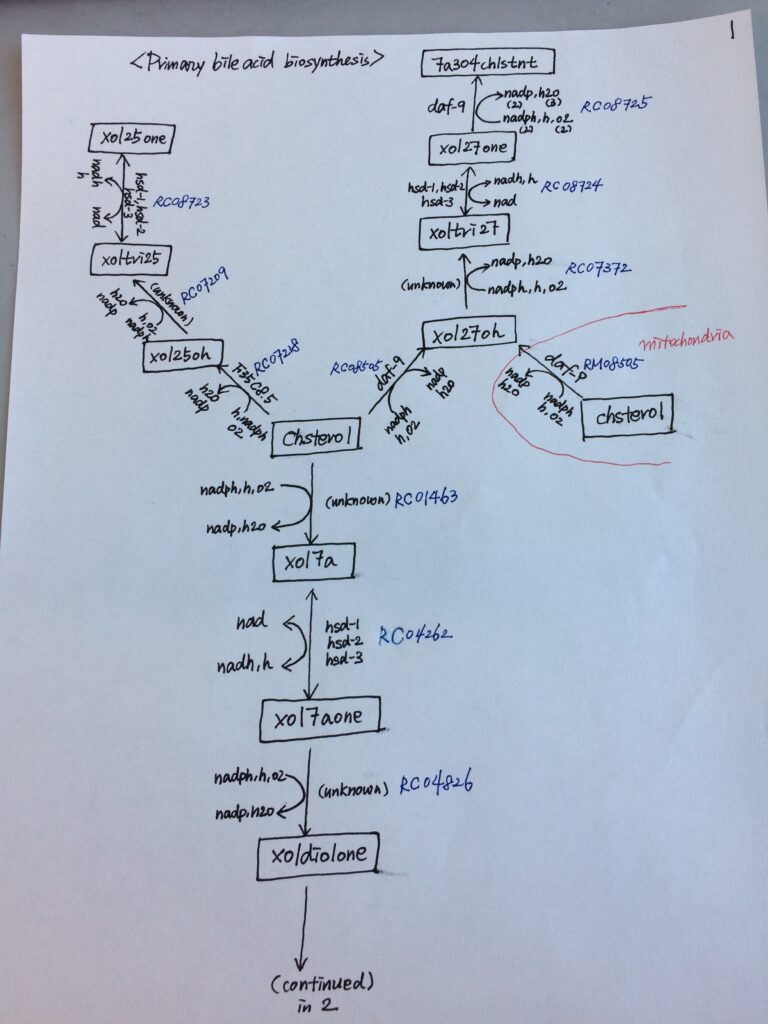
Lab members drew maps in different ways; there was a lot of freedom and creativity in map making. An example can be seen in the image to the right. When we agreed that the pathway was complete and correct, a team generated the pathway in a standardized format that could be uploaded to the internet. Another team would then double-check the pathway before it was uploaded to WormPaths, which is part of the WormFlux website. A standardized drawing for WormPaths is shown in the image. Standardization took much more time and extended long after the lockdown ended, but by then we were all committed to seeing the project through. In WormPaths, pathways are not only visualized and connected to each other, they are also searchable, printable, and downloadable in three formats. Moreover, we generated a tool for pathway enrichment analysis, for instance of gene expression data. A manuscript describing this project in detail is online in GENETICS.
WormPaths has become an essential part of our daily research. It is one of our projects and papers that fills me the most with joy; I am exquisitely proud of how my lab worked together during one of our most trying times. We expect WormPaths to be of great use to the C. elegans community and welcome any corrections or feedback on the maps. Now, all we have to do is create that metabolism navigation app, so we can search the network on our mobile phones!
About the Author:

Dr. A.J. Marian Walhout, PhD, is the Maroun Semaan Chair in Biomedical Research, Co-Director of the Program in Systems Biology, and Professor in the Program in Molecular Medicine. Dr. Walhout is a pioneer in Systems Biology. Her group has gained numerous insights into how genes function in the context of complex biological networks that connect regulatory processes and metabolism. She has gained insights into how vitamins in our diet affect gene regulatory and metabolic networks that control development, growth and overall health. Her findings offer opportunities for personalized medicine to prevent and treat a variety of both rare and common human diseases.
Guest posts are contributed by members of our community. The views expressed in guest posts are those of the author(s) and are not necessarily endorsed by the Genetics Society of America. If you'd like to write a guest post, e-mail communications@genetics-gsa.org.
View all posts by Guest Author »Read more in
-

Hongyu Zhao joins GENETICS as new Senior Editor
A new senior editor is joining GENETICS in the Statistical Genetics and Genomics section. We’re excited to welcome Hongyu Zhao to the editorial team. Hongyu ZhaoSenior Editor Hongyu Zhao is the Ira V. Hiscock Professor of Biostatistics, Professor of Genetics, and Professor of Statistics and Data Science at Yale University. He received his BS in…
-
GSA Member Julio Molina Pineda Receives DeLill Nasser Award, Shines at TAGC 2024
“At any career stage, the GSA membership is an amazing investment for any genetics professional!” Julio Molina Pineda is a PhD Candidate in Cell and Molecular Biology and a Research Assistant at the University of Arkansas, and a Doctoral Academy Fellow at the Lewis Lab. In 2023, Julio was awarded the DeLill Nasser Award for…
-
In Memoriam: Ellsworth Herman Grell (1932–2023), a pioneer of Drosophila genome engineering and annotation
Ellsworth (Ed) Grell blessed the Drosophila community through three enduring legacies: as a pioneer of chromosome mechanics, as a primary organizer and synthesizer of genetic knowledge in Drosophila, and as a graceful mentor to those fortunate to have known him personally. Ed grew up in rural Nebraska, completed his undergraduate studies at Iowa State, and…
-

Congratulations to the #Fungal24 Poster Award winners!
We are pleased to announce the recipients of the GSA Poster Awards for posters presented at the 32nd Fungal Genetics Conference! Undergraduate and graduate student members of GSA were eligible for the awards, and a hard-working team of judges made the determinations. Congratulations to all! Felicia Ebot Ojong, The University of Georgia My research is focused…
-
Poster presentation tips for TAGC 2024
You’ve been selected to present a poster at The Allied Genetics Conference 2024 in March—you’ve celebrated, made plans to attend, now what? This is an exciting opportunity to showcase your research and engage with fellow members of the genetics community, so you want to make sure you’re prepared. We wanted to offer you some tips…
-

Maximize your TAGC 2024 experience
A guide to all that National Harbor & DC have to offer Are you joining us for The Allied Genetics Conference 2024 in March? Make the most of your #TAGC24 experience in National Harbor! We know the science will keep you busy, but you deserve to unwind and have some fun, so we’ve curated a…
-
Early Career Leadership Spotlight: Sarah Petrosky
We’re taking time to get to know the members of the GSA’s Early Career Scientist Committees. Join us to learn more about our early career scientist advocates. Sarah PetroskyMultimedia SubcommitteeUniversity of Pittsburgh Research Interest I am interested in understanding adaptation that has been happening recently in populations by dissecting the ways that genes underlying an adaptation…
-
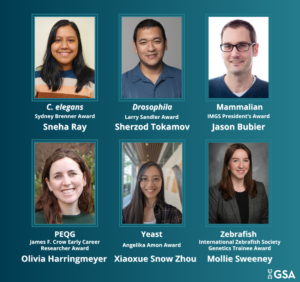
TAGC 2024 Early Career Award Winners
GSA is pleased to announce the winners of the early career awards presented at The Allied Genetics Conference 2024. These awards are specific to particular TAGC communities and recognize early career scientists’ outstanding work on their respective research organisms. The awardees will present their talks in keynote sessions at TAGC 2024. Don’t miss the opportunity…
-

Preeminent geneticists recognized with revamped GSA Awards
In 2022, GSA’s Board of Directors launched an audit to review the five major awards conferred by the Society. Today, we are thrilled to announce the recipients of the reimagined GSA Awards, including the new Genetics Society of America Early Career Medal. The scientists honored this year are recognized by their peers for their outstanding…
-
Fly Board funds outreach programs to spread the word about Drosophila research
In 2020, the Fly Board voted to use part of its reserve fund to support efforts to increase trainee participation as well as equity and diversity in the Drosophila community. An awards committee decides how the money will be spent each year, and from 2020–2022, the committee posted a very broad call for applications from…
-

New members of the GSA Board of Directors: 2024–2026
We are pleased to announce the election of four new leaders to the GSA Board of Directors: 2024 Vice President/2025 President Brenda Andrews Professor, University of Toronto It’s an honor to continue my association with the Society by serving as Vice President of the Board of Directors. I have broad knowledge of the ongoing activities…
-
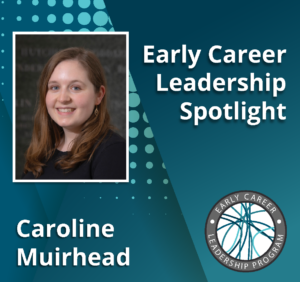
Early Career Leadership Spotlight: Caroline Muirhead
We’re taking time to get to know the members of the GSA’s Early Career Scientist Committees. Join us to learn more about our early career scientist advocates. Caroline MuirheadCommunication and Outreach SubcommitteeWorcester Polytechnic Institute Research Interest I didn’t always know I wanted to make science my career. In fact, I started college as an engineering major.…