

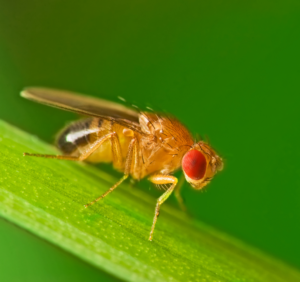
One feverish night, just over 100 years ago, an undergraduate in Thomas Hunt Morgan’s lab created the first genetic map. Realizing that the frequency of crossing over could be used to work out out the linear order of genes on a chromosome, that student, Alfred Sturtevant, published his map in 1913 and laid the foundation for a century of genome analysis. Today, even with the rise of rapid sequencing methods, meiotic maps still play a critical role in assembling whole genome sequences and tracing the evolution of genomes. In this month’s issue of GENETICS, Amores et al. use meiotic mapping to reveal some surprising features of genome evolution in fish.

Platyfish male over a circle plot where each line connects a cognition gene with its teleost genome duplicate. Tu: melanoma tumor control region on sex chromosome. R/Diff: tumor suppressor locus on chromosome 5. Image credit: Manfred Schartl and Ingo Braasch.
Chromosome numbers in teleost fish are relatively stable compared to mammals. For example, some deer species have 40 chromosomes, while others have just three. In contrast, 58% of teleosts have either 24 or 25 chromosomes. To explore this karyotype stability, the authors made an extensive RAD-tag genetic map for platyfish (Xiphophorus maculatus) and aligned the map to contigs and scaffolds from the platyfish reference genome, identifying likely assembly errors in the process. By comparing the results with other fish species, they found a striking stability of chromosome gene content.
For example, several entire chromosomes are maintained intact between zebrafish and platyfish, whose lineages separated around 300 million years ago. The authors also showed that about 80% of platyfish chromosomes have a one-to-one relationship with medaka fish chromosomes, even though they have been diverging for 120 million years. In contrast, mouse and human lineages diverged only about 75 million years ago, but only their X chromosomes show a one-to-one relationship. The work also reveals how reduced chromosome numbers in stickleback and green pufferfish arose independently by fusion of pairs of ancestral chromosomes after their lineages diverged from platyfish.
From Sturtevant’s simple diagram of six Drosophila “factors,” to a platyfish map of over 16,000 markers, meiotic maps have grown larger and more detailed, but remain powerful tools for understanding how genomes function and evolve. Read the article.
A RAD-Tag Genetic Map for the Platyfish (Xiphophorus maculatus) Reveals Mechanisms of Karyotype Evolution Among Teleost Fish Angel Amores, Julian Catchen, Indrajit Nanda, Wesley Warren, Ron Walter, Manfred Schartl, and John H. Postlethwait Genetics June 2014 197:625-641 doi:10.1534/genetics.114.164293
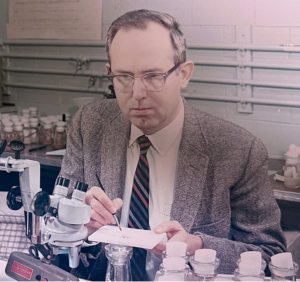
Cristy Gelling is a science writer, lapsed yeast geneticist, and former Communications Director at the GSA.
View all posts by Cristy Gelling »Read more in
-
In Memoriam: Ellsworth Herman Grell (1932–2023), a pioneer of Drosophila genome engineering and annotation
Ellsworth (Ed) Grell blessed the Drosophila community through three enduring legacies: as a pioneer of chromosome mechanics, as a primary organizer and synthesizer of genetic knowledge in Drosophila, and as a graceful mentor to those fortunate to have known him personally. Ed grew up in rural Nebraska, completed his undergraduate studies at Iowa State, and…
-

Congratulations to the #Fungal24 Poster Award winners!
We are pleased to announce the recipients of the GSA Poster Awards for posters presented at the 32nd Fungal Genetics Conference! Undergraduate and graduate student members of GSA were eligible for the awards, and a hard-working team of judges made the determinations. Congratulations to all! Felicia Ebot Ojong, The University of Georgia My research is focused…
-
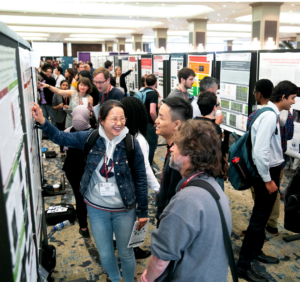
Poster presentation tips for TAGC 2024
You’ve been selected to present a poster at The Allied Genetics Conference 2024 in March—you’ve celebrated, made plans to attend, now what? This is an exciting opportunity to showcase your research and engage with fellow members of the genetics community, so you want to make sure you’re prepared. We wanted to offer you some tips…
-

Maximize your TAGC 2024 experience
A guide to all that National Harbor & DC have to offer Are you joining us for The Allied Genetics Conference 2024 in March? Make the most of your #TAGC24 experience in National Harbor! We know the science will keep you busy, but you deserve to unwind and have some fun, so we’ve curated a…
-
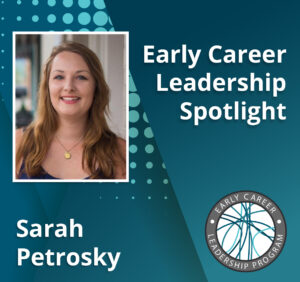
Early Career Leadership Spotlight: Sarah Petrosky
We’re taking time to get to know the members of the GSA’s Early Career Scientist Committees. Join us to learn more about our early career scientist advocates. Sarah PetroskyMultimedia SubcommitteeUniversity of Pittsburgh Research Interest I am interested in understanding adaptation that has been happening recently in populations by dissecting the ways that genes underlying an adaptation…
-
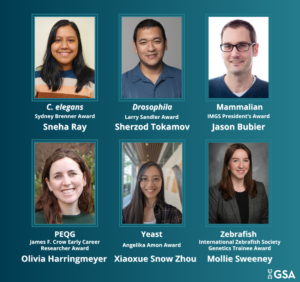
TAGC 2024 Early Career Award Winners
GSA is pleased to announce the winners of the early career awards presented at The Allied Genetics Conference 2024. These awards are specific to particular TAGC communities and recognize early career scientists’ outstanding work on their respective research organisms. The awardees will present their talks in keynote sessions at TAGC 2024. Don’t miss the opportunity…
-

Preeminent geneticists recognized with revamped GSA Awards
In 2022, GSA’s Board of Directors launched an audit to review the five major awards conferred by the Society. Today, we are thrilled to announce the recipients of the reimagined GSA Awards, including the new Genetics Society of America Early Career Medal. The scientists honored this year are recognized by their peers for their outstanding…
-
Fly Board funds outreach programs to spread the word about Drosophila research
In 2020, the Fly Board voted to use part of its reserve fund to support efforts to increase trainee participation as well as equity and diversity in the Drosophila community. An awards committee decides how the money will be spent each year, and from 2020–2022, the committee posted a very broad call for applications from…
-

New members of the GSA Board of Directors: 2024–2026
We are pleased to announce the election of four new leaders to the GSA Board of Directors: 2024 Vice President/2025 President Brenda Andrews Professor, University of Toronto It’s an honor to continue my association with the Society by serving as Vice President of the Board of Directors. I have broad knowledge of the ongoing activities…
-
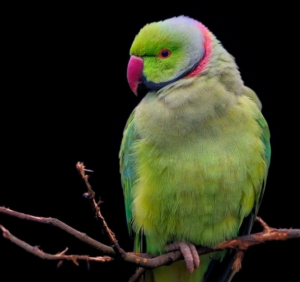
Parrot plumage study aids breeders and endangered natural populations
Yellow coloration is maladaptive in the wild but prized by breeders. People have long been fascinated with birds, which exhibit one of the widest ranges of coloration among vertebrates. Parrots, in particular, have captivated humans by their ability to mimic human speech and spectacular plumage. Brightly colored feathers are used primarily to attract mates, intimidate…
-
Early Career Leadership Spotlight: Sarah Gilmour
We’re taking time to get to know the members of the GSA’s Early Career Scientist Committees. Join us to learn more about our early career scientist advocates. Sarah GilmourMultimedia SubcommitteeStowers Institute for Medical Research Research Interest Questions of evolution have always fascinated me. I am extremely fortunate to be starting out my research career in a…